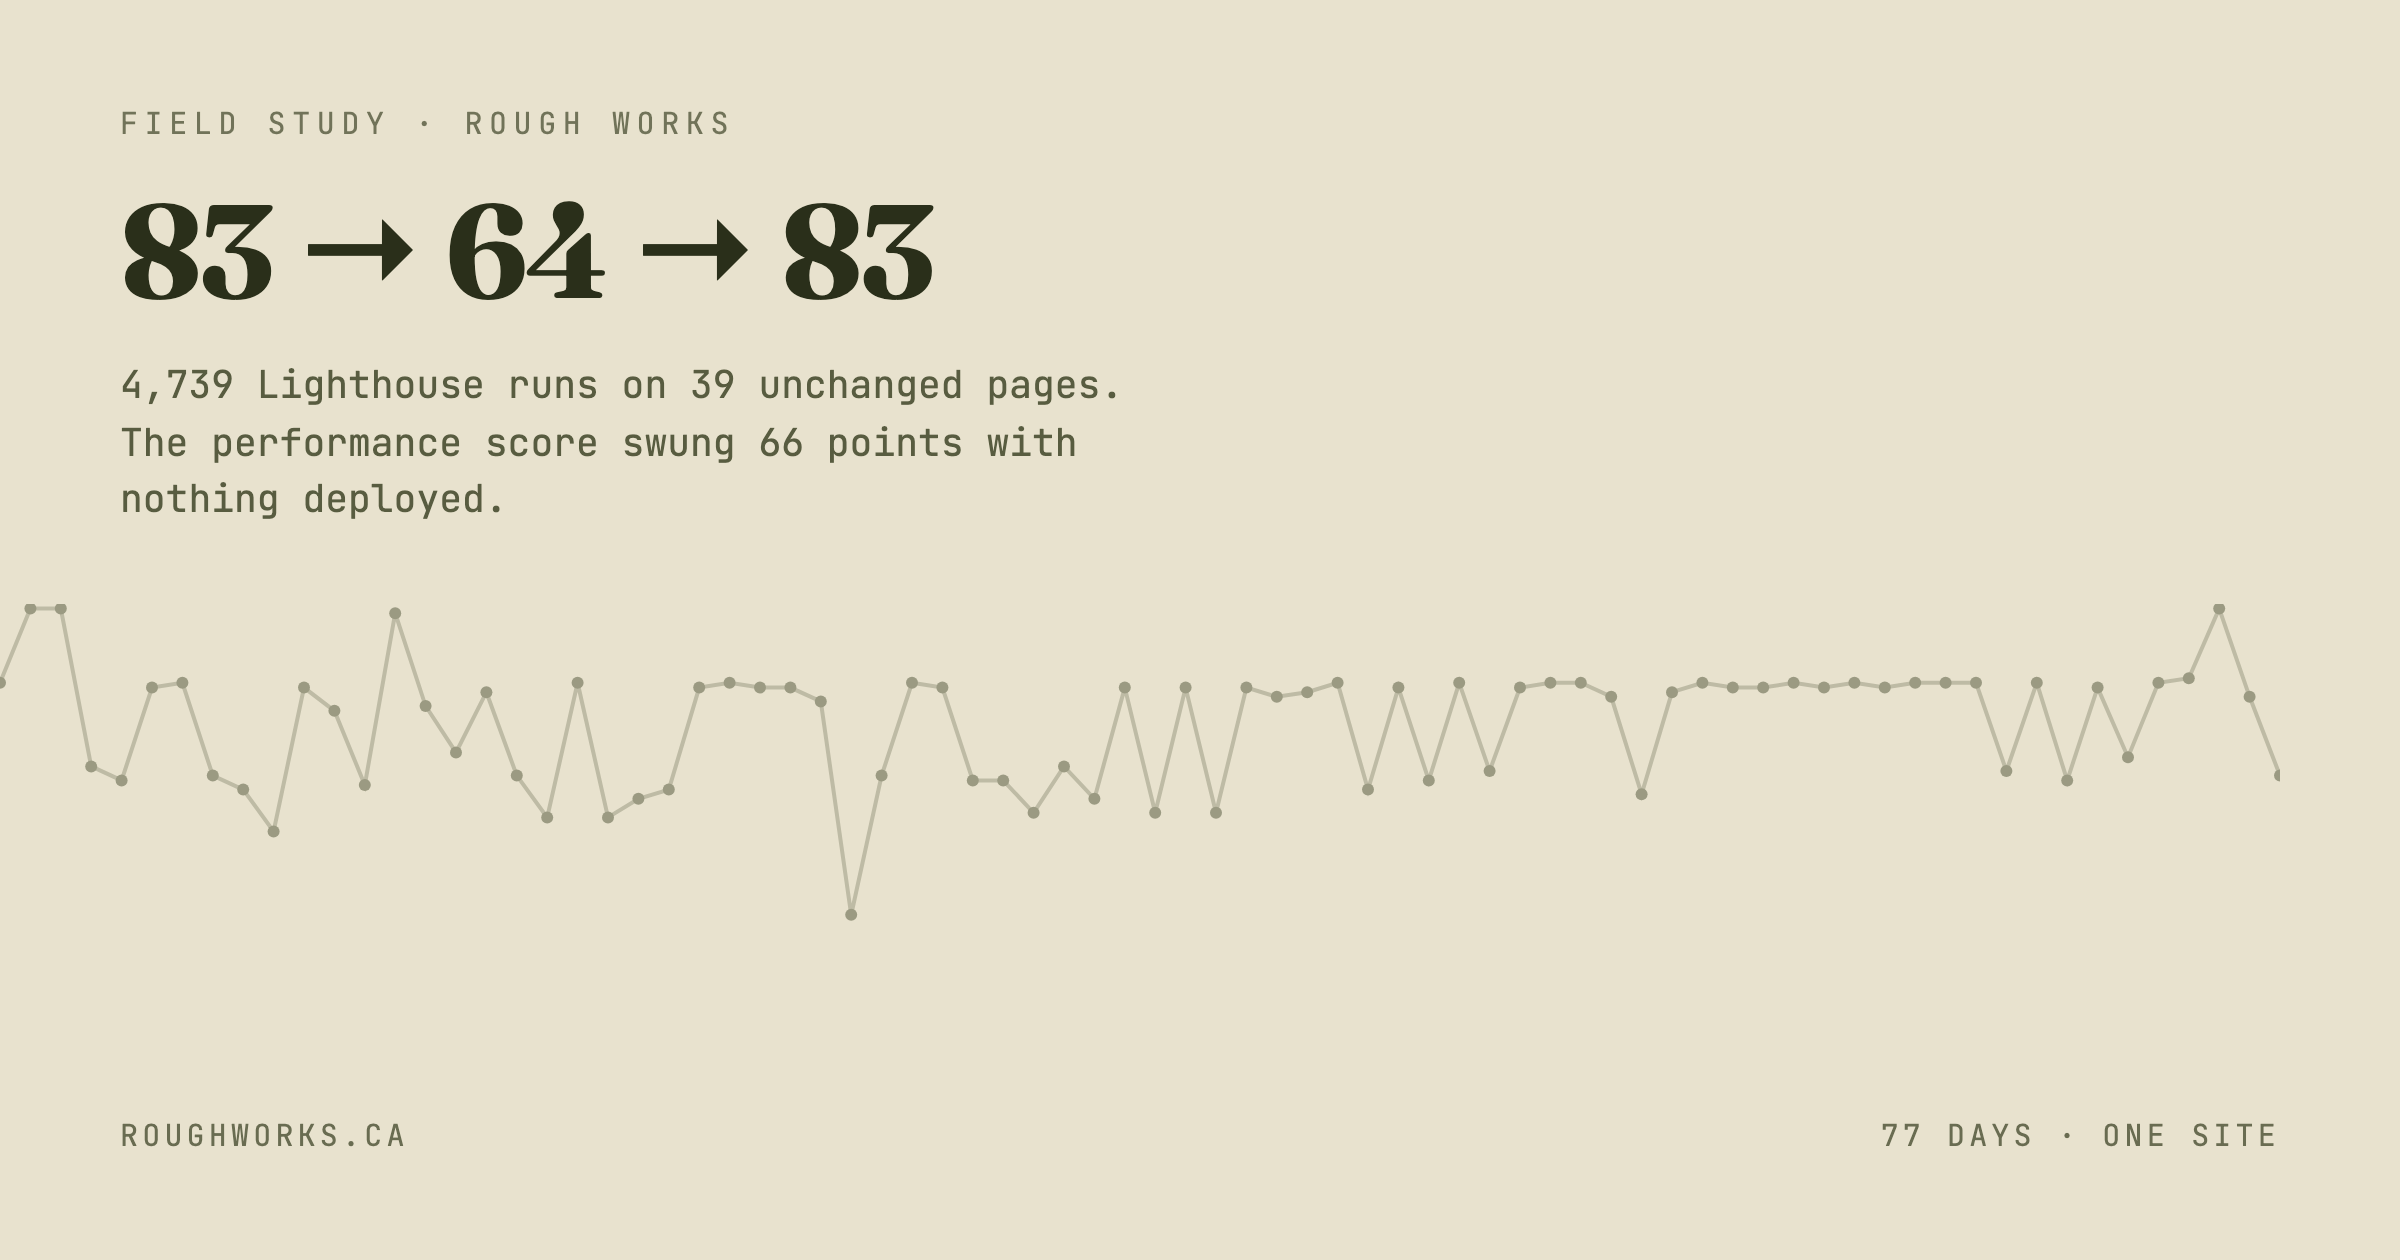
- We ran Lighthouse 4,739 times against 39 unchanged pages of our own site over 77 days. One page swung 66 points — 33 to 99 — with nothing deployed to it.
- On mobile, 44% of consecutive daily measurements differ by 10 points or more, and 16% by 20 or more. Half of all pairs move 7 points or more overnight.
- Performance is the only unreliable category score. SEO was unchanged on 99.9% of consecutive runs and accessibility on 98.7%. When those move, something real moved them — so those are the scores worth acting on.
- The reason is structural: 55% of the performance score rides on Total Blocking Time and Largest Contentful Paint, the two noisiest things Lighthouse measures (83.9% and 52.5% median variation on an unchanged page).
- To trust a 5-point improvement you would need about 50 runs before and 50 after. Compare 7-day medians instead, ignore anything under 10 points, and use Chrome User Experience Report field data for the question you actually care about.
- A red score in a sales email is one run on a throttled mobile profile. That is not a measurement.
A prospect forwarded us an email last month. Another agency had run their site through PageSpeed Insights, screenshotted a red 42, and written two paragraphs about what that number said about the people who built it.
We ran the same page. It scored 78.
Neither of us was lying. We had just pressed the button at different moments, and the number that came back is far less stable than the confidence people attach to it. We know this because we have been measuring our own site every morning for the better part of three months, and we kept the results.
That is 4,739 Lighthouse runs against 39 pages of roughworks.ca, every day from June 1 to August 18, 2026, mobile and desktop, collected by the daily audit agent we built last year. It was never meant to be a study of measurement error. It was meant to catch regressions. It caught something else first: the tool itself moves more than most of the things we were watching for.
What we measured, and how
Every morning a scheduled job walks our sitemap, calls the PageSpeed Insights API once per URL per form factor, and writes the four category scores plus the underlying metrics into a SQLite database that lives in the repo. Same job, same endpoint, same hour of the day — the pulls land between 04:00 and 07:00 UTC. Nothing about the collection changed across the 77 days.
Two things make this dataset unusually clean for asking "how much does this number wander?"
The first is that we have the deploy history. The site is static HTML in a git repository, and every change to it is a commit with a timestamp. So for any two measurements, we can check whether the page actually changed in between, instead of assuming.
The second is that most of these pages are boring. A case study page loads a poster image and a video. An industry page loads text and two images. These are not applications with a heavy runtime whose behaviour swings with the data. Between one morning and the next, the bytes are usually byte-identical.
Which makes the following chart strange.
That is one page — our Maurice Law case study — measured on mobile every morning for 77 days. The lowest reading is 33. The highest is 99. The page was not rebuilt in that window, and no deploy separates the extremes.
One page is an anecdote. Every page is a pattern.
If it were only the case-study pages, we would blame the video. It isn't.
Twelve pages, each measured about 75 times on mobile. The narrowest range in that group is 45 points. Our homepage-adjacent marketing pages, our blog posts, our industry pages — everything swings by roughly half the available scale.
The averages are stable and sensible. /maurice-law/ averages 74.5 with a standard deviation of 12.8. /game/, which loads an actual game, averages 66. Desktop averages 91.8 across the whole site and mobile averages 71.1, exactly the gap you'd expect. The centre of each distribution is telling the truth. It is the single reading that lies.
And a single reading is what almost every conversation about site speed is based on.
The night the score fell 19 points and nobody shipped anything
Here is the sequence I keep coming back to, because it's the one with a paper trail:
| Date | Mobile performance | What we deployed |
|---|---|---|
| Aug 7 | 83 | — |
| Aug 8 | 64 | — |
| Aug 9 | 83 | — |
| Aug 10 | 62 | — |
| Aug 11 | 82 | — |
Nineteen points down, nineteen back, twenty down, twenty back. Four consecutive mornings, same URL, same collector.
I checked the repository rather than trusting my memory of what we'd been working on. Between the August 7 measurement at 04:50 UTC and the August 9 measurement at 04:12 UTC, the only files that changed anywhere in the project were an internal dashboard page and the database the agent writes to. Not one file that /maurice-law/ loads. Not the HTML, not the CSS, not the video, not a shared script.
# every commit between the 83 and the next 83
$ git log --since='2026-08-07T05:00:00+00:00' \
          --until='2026-08-09T04:12:00+00:00' \
          --pretty=format: --name-only | sort -u

_local/agent/REVIEW_QUEUE.md
_local/agent/data/agent.db
agent-bcbf1c55c88d79ae/index.html
The 64 was not a regression. It was weather.
Zoom out from that one page and the pattern is consistent across the whole dataset. Here is how far the score travels between one morning and the next, across every page we track:
On mobile, 44% of consecutive measurements differ by 10 points or more. Sixteen percent differ by 20 or more. The largest overnight swing we recorded was 57 points. Desktop is calmer — 24% move by 10 or more — but "calmer" still means a quarter of nights produce a double-digit change on a site where nothing happened.
Half of all mobile pairs move by 7 points or more. If your monthly report has a line that says "performance improved from 71 to 78," that sentence contains no information.
Which Lighthouse numbers move on their own, and which don't
This is the part that changed how we work, and it's the reason I'd rather publish the whole dataset than the horror story.
Lighthouse gives you four category scores. They are not equally trustworthy, and the difference isn't subtle.
Measured as run-to-run variation on the same unchanged page:
- SEO: does not move. Across 2,327 consecutive mobile pairs, the SEO score changed at all in fewer than one percent of cases. It is a checklist — is there a title, a meta description, a valid canonical, crawlable links — and checklists don't care how busy the machine was.
- Accessibility: barely moves. Unchanged 99% of the time, and the largest single change we ever recorded was 6 points. Also mostly a checklist: contrast ratios, label associations, ARIA validity, heading order.
- Best practices: mostly stable, unchanged 82% of the time. It shifts when something environmental changes — a third-party script starts throwing a console error, a certificate detail changes.
- Performance: unstable by construction. Median run-to-run variation of 12.4%, and that understates it, because the underlying metrics are far worse: Largest Contentful Paint varies by a median of 52.5% on the same page, and Total Blocking Time by 83.9%.
So the correct reading of a Lighthouse report is almost the opposite of how they get used in sales emails. The three scores that people skip past are the reliable ones. The one that goes in the screenshot is the one you cannot trust from a single run.
If someone shows you a red accessibility score, believe them and go fix it. Ours sits at 95.7 and it is the same 95.7 every morning; when it moves, something real moved it. If someone shows you a red performance score, the only honest response is "how many times did you run it?"
Why performance is the flaky one
It isn't a bug. It falls out of how the number is assembled.
Every Lighthouse performance score is a weighted blend of five timing metrics. Pulled straight out of the report our own runs produced, from Lighthouse 12.8.2:
| Metric | Weight | What it measures | How stable we found it |
|---|---|---|---|
| Total Blocking Time | 30% | main-thread work between first paint and interactivity | 84% median variation |
| Largest Contentful Paint | 25% | when the biggest visible element finishes rendering | 52% median variation |
| Cumulative Layout Shift | 25% | how much the layout jumps around | stable — median spread of 0 |
| First Contentful Paint | 10% | when anything appears | 12% median variation |
| Speed Index | 10% | how quickly the page fills in visually | — |
Fifty-five percent of the score rides on the two metrics that vary the most. Total Blocking Time alone carries 30% of the weight and is, in our data, the single noisiest thing Lighthouse reports — because it is a measurement of how a specific CPU behaved during a specific few seconds, on a shared machine you don't control, with an emulated slow processor and a simulated slow network layered on top.
There's a second amplifier. Each metric is converted to a 0–100 sub-score through a curve, not a straight line, and the curve is steepest right in the middle where most real sites live. Down at the flat ends, a big change in milliseconds moves the score barely at all. In the middle, a couple of hundred milliseconds of blocking time can move the composite by ten points. Our pages sit in the middle. So does almost every business site.
Add the fact that the runner reports its own machine speed with every result — Lighthouse calls it benchmarkIndex — and the shape of the problem becomes clear. You aren't measuring your website. You are measuring your website plus whatever else that machine was doing at that moment.
Ten runs, one hour, one machine
The daily dataset has one weakness: each measurement is 24 hours from the last, so somebody can always argue that something out there changed — a CDN node, a network route, Google's fleet.
So we ran the control. One URL, unchanged, ten Lighthouse runs back to back on a single laptop in a single sitting, mobile and desktop, nothing else touching the machine.
Thirty runs, eight minutes, one URL that hadn't been touched in days.
The first ten mobile runs came back 62, 65, 66, 67, 67, 69, 89, 94, 97, 100. The same page, the same laptop, the same four-minute window, and the full width of the useful scale. Largest Contentful Paint across those ten runs ranged from 1.77 seconds to 9.75 seconds — on bytes that were byte-identical every time.
There's an obvious objection, and it's the right one: our laptop was doing other work during that batch, so of course the numbers wobbled. So we ran it again with the machine deliberately idle, nothing else executing, two minutes later.
The spread barely moved. 64, 66, 83, 94, 94, 97, 97, 97, 99, 100 — a 36-point range against the busy batch's 38.
What did move was the middle. The busy batch had a median of 68. The idle batch, on the same page two minutes later, had a median of 95.5. So machine conditions set the level of the score, and something else entirely produces the scatter around it — in our runs, mostly Largest Contentful Paint deciding to take five times longer for no visible reason. Total Blocking Time correlated with the final score at -0.73 in that batch, which is exactly what you'd expect from a metric carrying 30% of the weight and swinging between 30 and 126 milliseconds.
Sit with the implication for a second. Two batches of ten runs, on one machine, two minutes apart, produced medians 27 points apart. Ten runs is more rigour than any audit email you have ever received, and ten runs still wasn't enough to pin the number down.
One caveat, since it cuts against us: these runs used the Lighthouse CLI on a Mac laptop, not Google's PSI infrastructure, so the absolute numbers aren't comparable to the daily dataset above. That's fine — the question here isn't "what does this page score," it's "does the same page score the same thing twice." It doesn't, on either.
What a 42 in a sales email actually tells you
Almost nothing about your website. Quite a lot about the person who sent it.
There are three moves in that email, and once you've seen them you can't unsee them:
One run, presented as a measurement. The number came from pressing the button once. The honest version of that email would say "we ran it five times and took the median," and you have never received that email.
Mobile, presented without saying so. PageSpeed Insights defaults to a heavily throttled mobile profile — a simulated mid-tier Android on a slow connection. Our own site averages 71 on mobile and 92 on desktop for the identical pages. Choosing the mobile tab is choosing the worse number, and it's the default, so it happens without anyone deciding to be dishonest.
A lab score, presented as user experience. This is the important one. Lighthouse is a lab tool: one synthetic device, one synthetic network, one moment. Google also publishes the Chrome User Experience Report, which is what real Chrome users on your real site actually experienced over the trailing 28 days — and that's the data used in ranking systems, not your lab score. When a page has enough traffic, PSI shows the field data at the top of the report, above the lab section. Most audit emails screenshot the bottom half.
None of which means your site is fast. It might be genuinely slow, and ours has real problems — our case-study pages carry video, and a mobile average of 71 is not a number we're proud of. We've made heavy pages fast before, on client stores where it paid: 360 pre-rendered frames instead of WebGL got a jewellery storefront its scroll-driven 3D effect at 95-plus Lighthouse. So we know the difference between a page that's slow and a number that's noisy. The point is narrower: a single Lighthouse performance score is not evidence of anything. It cannot distinguish a slow page from a busy runner, and the person quoting it at you usually can't either.
If you want to know whether your site is slow, look at the field data. It's free, it covers 28 days of real visits, and it doesn't move 20 points overnight.
How many runs before you can believe a change
We wanted a rule instead of a vibe, so we worked it out from our own numbers. The median within-page standard deviation for mobile performance in our dataset is 8.9 points. Run that through a standard two-sample comparison — 95% confidence, 80% power — and you get the number of runs you'd need on each side to trust a difference of a given size:
| Change you want to detect | Runs needed before, and after |
|---|---|
| 5 points | 50 |
| 10 points | 13 |
| 15 points | 6 |
| 20 points | 4 |
Fifty runs per side to confirm a five-point improvement. That is the actual cost of the sentence "we improved your score by five points," and nobody pays it.
Two practical consequences we now live by:
Don't chase changes under 10 points. On mobile they're indistinguishable from noise unless you're prepared to run the test a dozen times. Spend the time on something whose effect you can see without statistics — cutting a 2 MB hero image in half, removing a third-party script, deferring a font. Those changes also survive a redesign, unlike a score you tuned for one week in June.
Compare medians of a window, never two single runs. We compare a trailing 7-day median against the previous 7-day median. It's crude and it works: a real regression persists across mornings, and weather doesn't.
There's a third one that we didn't expect. Because the score wanders, "which of our pages is the slowest" is a question with a different answer every day. On 91% of the day-to-day transitions in our data, a different page held the title of worst-scoring page on the site, and 28 of our 39 pages held it at least once. Any prioritisation built on a single day's ranking is prioritisation by dice roll.
What we changed about our own monitoring
The daily agent still runs. What we did was stop letting it shout.
It used to flag any page that dropped more than a few points overnight, which meant it flagged something almost every morning, which meant we stopped reading it — the classic alerting death spiral. Now the rules are:
- Performance alerts fire on a 7-day median moving more than 10 points against the previous week, never on a single day.
- Accessibility, SEO and best-practices alerts fire on any change at all, because in this dataset those scores changing is genuinely news.
- The individual timing metrics — LCP, TBT, CLS — are stored and charted but never alerted on directly. They're diagnostics for after something real has been detected, not detectors.
- Anything we ship that is supposed to make the site faster gets measured as a before-and-after median across at least a week, or it doesn't get a performance claim attached to it.
One honest caveat about our own data: we log the server-response-time audit as a TTFB column, and the values it produces are implausibly low — single-digit milliseconds — so we don't use that column for anything and neither should you if you copy this setup. Every other number in this post comes from the four category scores and the core metrics, which we've checked against raw Lighthouse output.
If you only remember four things
The performance score is the least reliable number in the report, and the only one anybody quotes. Half our mobile measurements move seven points or more overnight on pages nobody touched.
The other three scores are excellent. Accessibility, SEO and best practices barely move. When they change, something changed. Use them — they're free, specific, and actionable, and almost nobody reads them. The SEO category pairs well with structural work like internal linking and topic clusters, where the wins are real and the measurement isn't a coin flip.
A single run is not a measurement. Neither is two runs. If a change matters, take the median of several; if it doesn't matter enough to justify that, it doesn't matter enough to report.
Field data beats lab data for the question you actually care about. The Chrome User Experience Report tells you what your visitors experienced over 28 days. Lighthouse tells you what one throttled robot experienced once.
We publish this partly because it's useful and partly because we get compared on these numbers, and we'd rather compete on evidence than on whoever refreshed at the luckiest moment. If someone has sent you a red score and a proposal, forward it to us — we'll run the page properly, show you the spread, and tell you whether there's anything real underneath it. That takes about a day, and quite often the answer is that your site is fine and the email was a sales tactic.
If it isn't fine, we'll tell you that too, and show you the runs.